Customer Segmentation and Repurchase Prediction
For a company, the desire to know customers better never changes. Especially for an online store...

For an online store with large scale dataset, revealing the hidden pattern of purchase behavior becomes even more important. In this project, we aim to help the company understand their customer segmentation and make data-driven marketing strategy to target the right customer.
This dataset contains actual transactions from 2010 and 2011 for a UK-based online retailer. The company mainly sells unique all-occasion gifts. Many customers of the company are wholesalers. There are a few challenges in this dataset:
- Too few features, eight features only:
InvoiceNo, Stockcode, Description, Quantity, InvoiceDate, UnitPrice, CustomerID, Country - There is no product category attribute:
all product description is unstructured data, nearly 4000 unique product descriptions
Objectives
1. Customer Segmentation
Cluster more than 4000 customers into subgroups and analyze purchase behavior for each subgroup
2. Repurchase Prediction
Use binary classification to predict whether or not a customer will purchase product in the next month
I. Exploratory Data Analysis
The number of features in our raw data is not enough for in-depth analysis. For example, we want to know how many items customers tend to buy in each transaction, or the interval between visits.
Our raw data is lack of these feature. Therefore, we generated additional 17 features into 25 features in total such as (per customer):
- total spending
- unit price per transaction
- item per transaction
- time interval between visits
Some descriptive summaries:
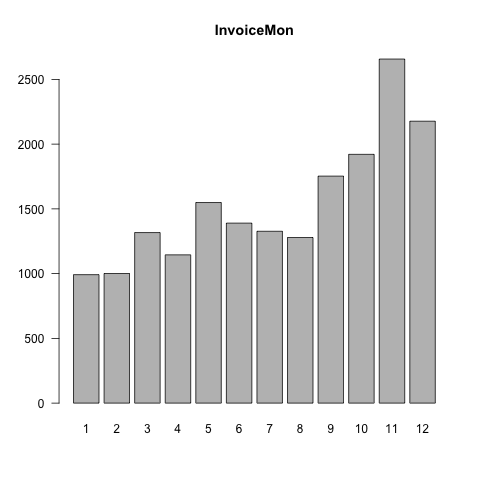
- Number of transactions significantly increased in November due to Thanksgiving. In order to analyze purchase behavior by season, we add four indicator variables into our dataset.
- Most customers are one-time buyer. Few customers tend to purchase more than 4 times.
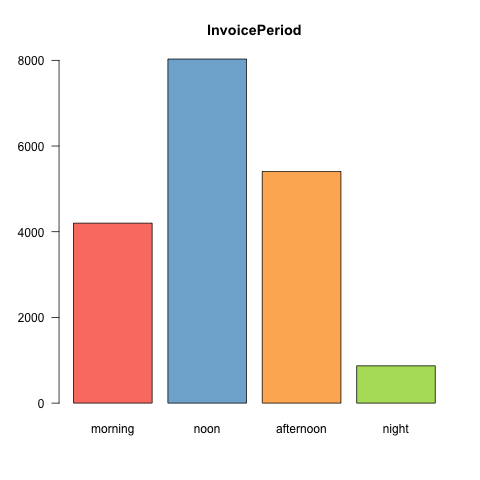
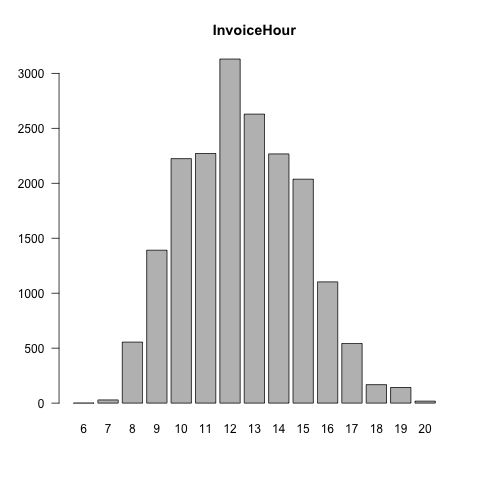
- Most transactions occur in the noon.
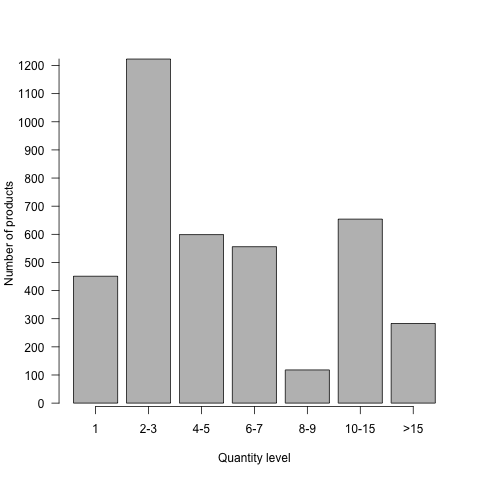
- The unit item per transaction falls between 2 to 3.
II. Product Categorization
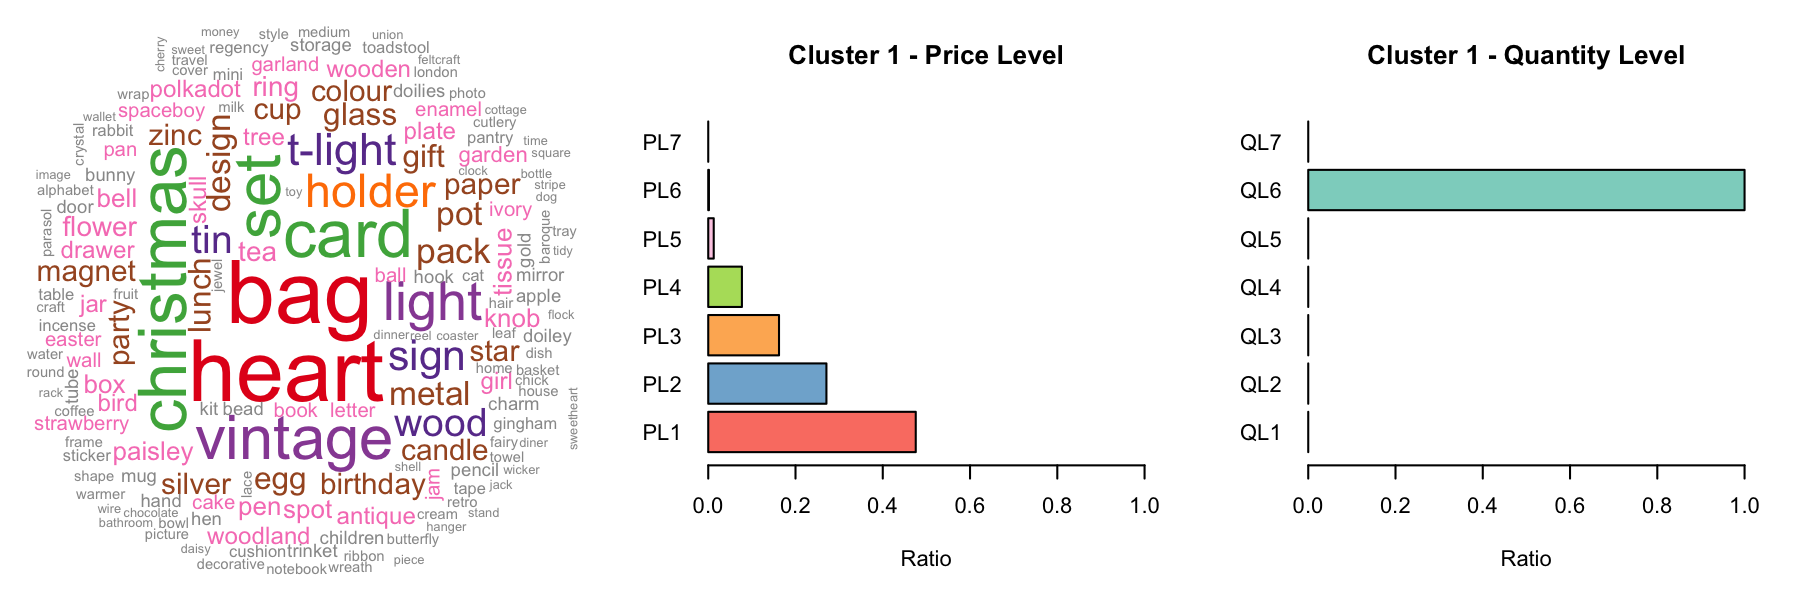
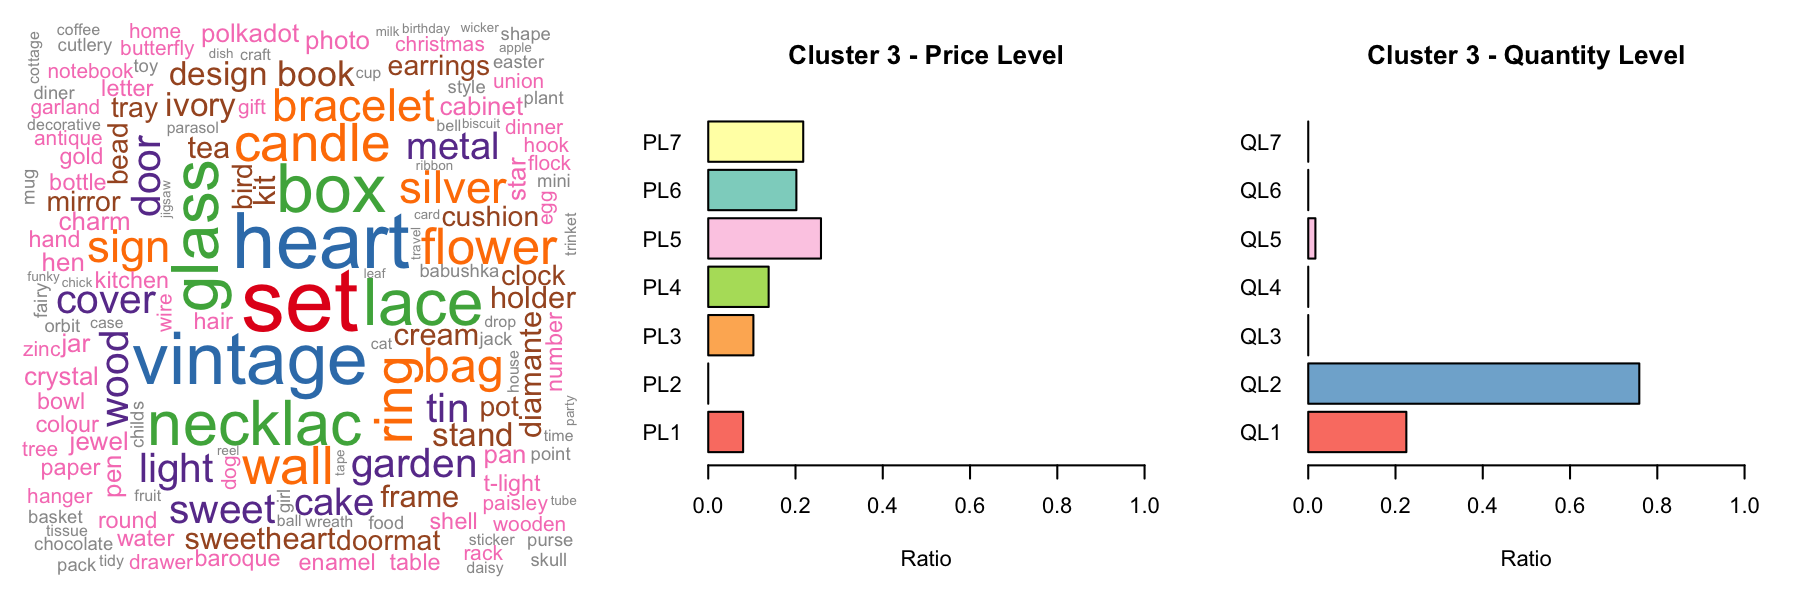
As mentioned above, it's difficult to do product-related analysis without knowing the category each product belongs to. To cluster the products, we first discretize products into different levles of price and quantity and use one-hot encoding to represent these features:
| Product | PL1 | PL2 | ... | PL7 | QL1 | QL2 | ... | QL7 |
|---|---|---|---|---|---|---|---|---|
| CHRISTMAS TREE HEART DECORATION | 1 | 0 | ... | 0 | 0 | 0 | ... | 1 |
| MINI PAINT SET VINTAGE | 0 | 1 | ... | 0 | 1 | 0 | ... | 0 |
To deal with the complicated product descriptions, we tokenized descriptions and kept all the nouns as keywork by Python nltk package. We narrowed over 4000 unique product description down to the 193 keywords.
And again add these keywords into features through ont-hot encoding.
| Product | heart | vintage | set | ... | christmas | ... | birthday | tree |
|---|---|---|---|---|---|---|---|---|
| CHRISTMAS TREE HEART DECORATION | 1 | 0 | 0 | ... | 1 | ... | 0 | 1 |
| MINI PAINT SET VINTAGE | 0 | 1 | 1 | ... | 0 | ... | 0 | 0 |
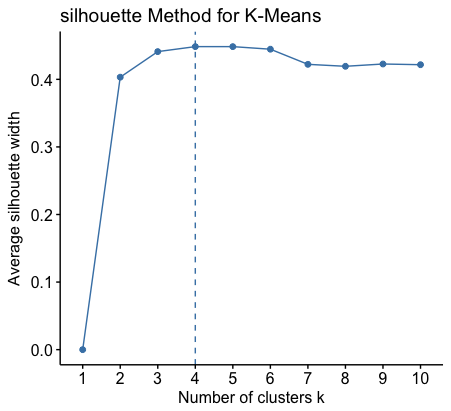
We then applied k-means clustering with silloutte methods to categorize the products.
III. Customer Segmentation
To reduce our model's complexity and tackle 'curse of dimensionality', we used tSNE instead of PCA to perform the dimension reduction. With tSNE, we transform our features into 2 dimensional representation.
Then, applied k-means clustering to segment cutomers.
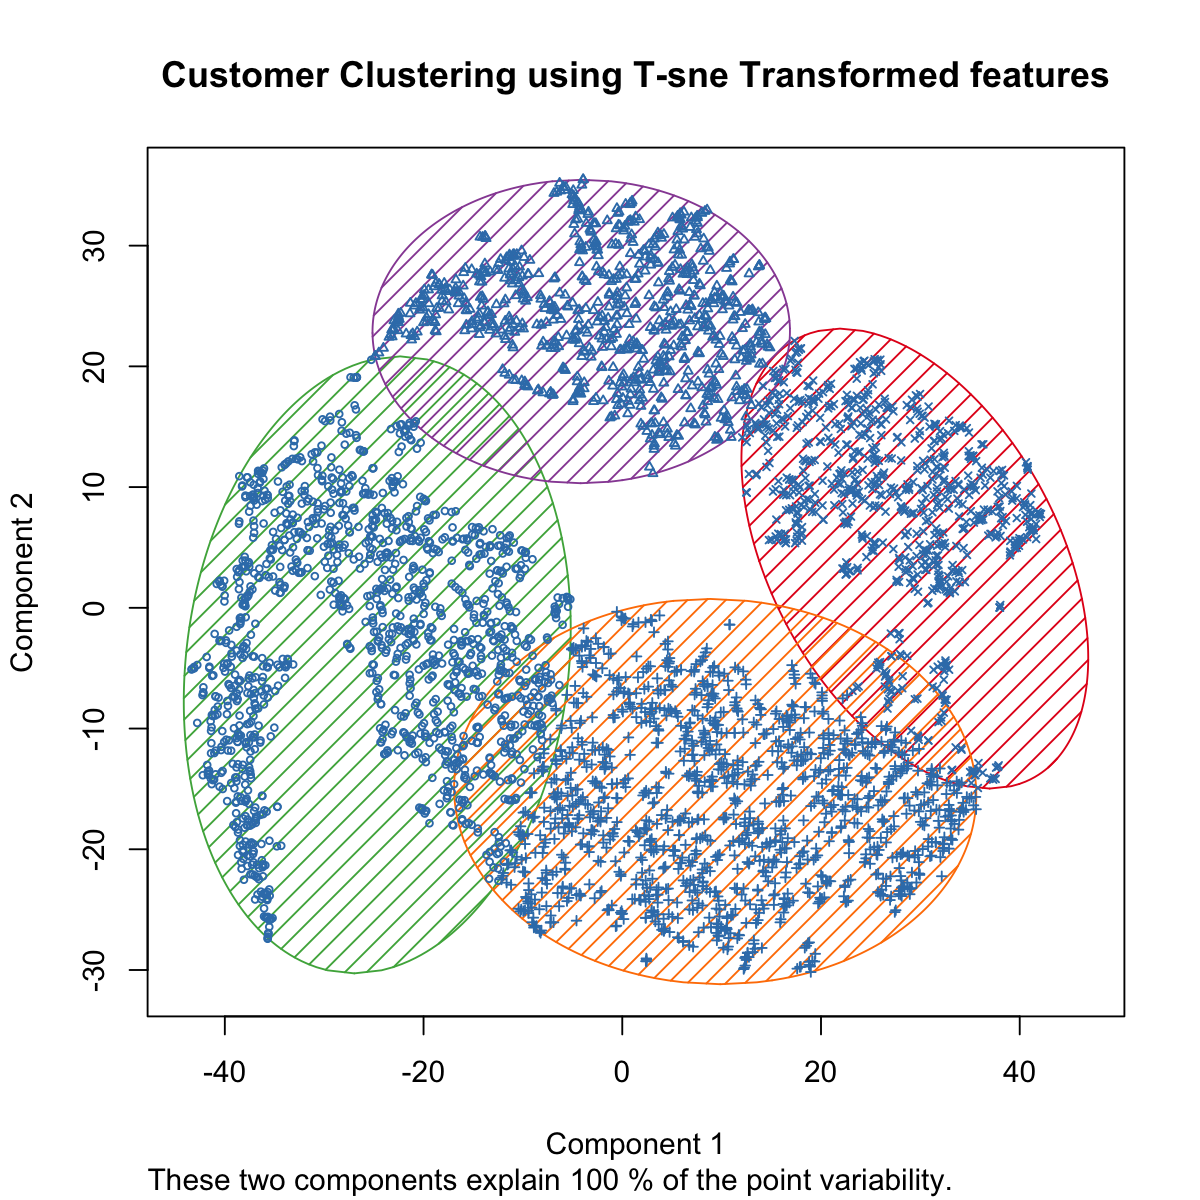
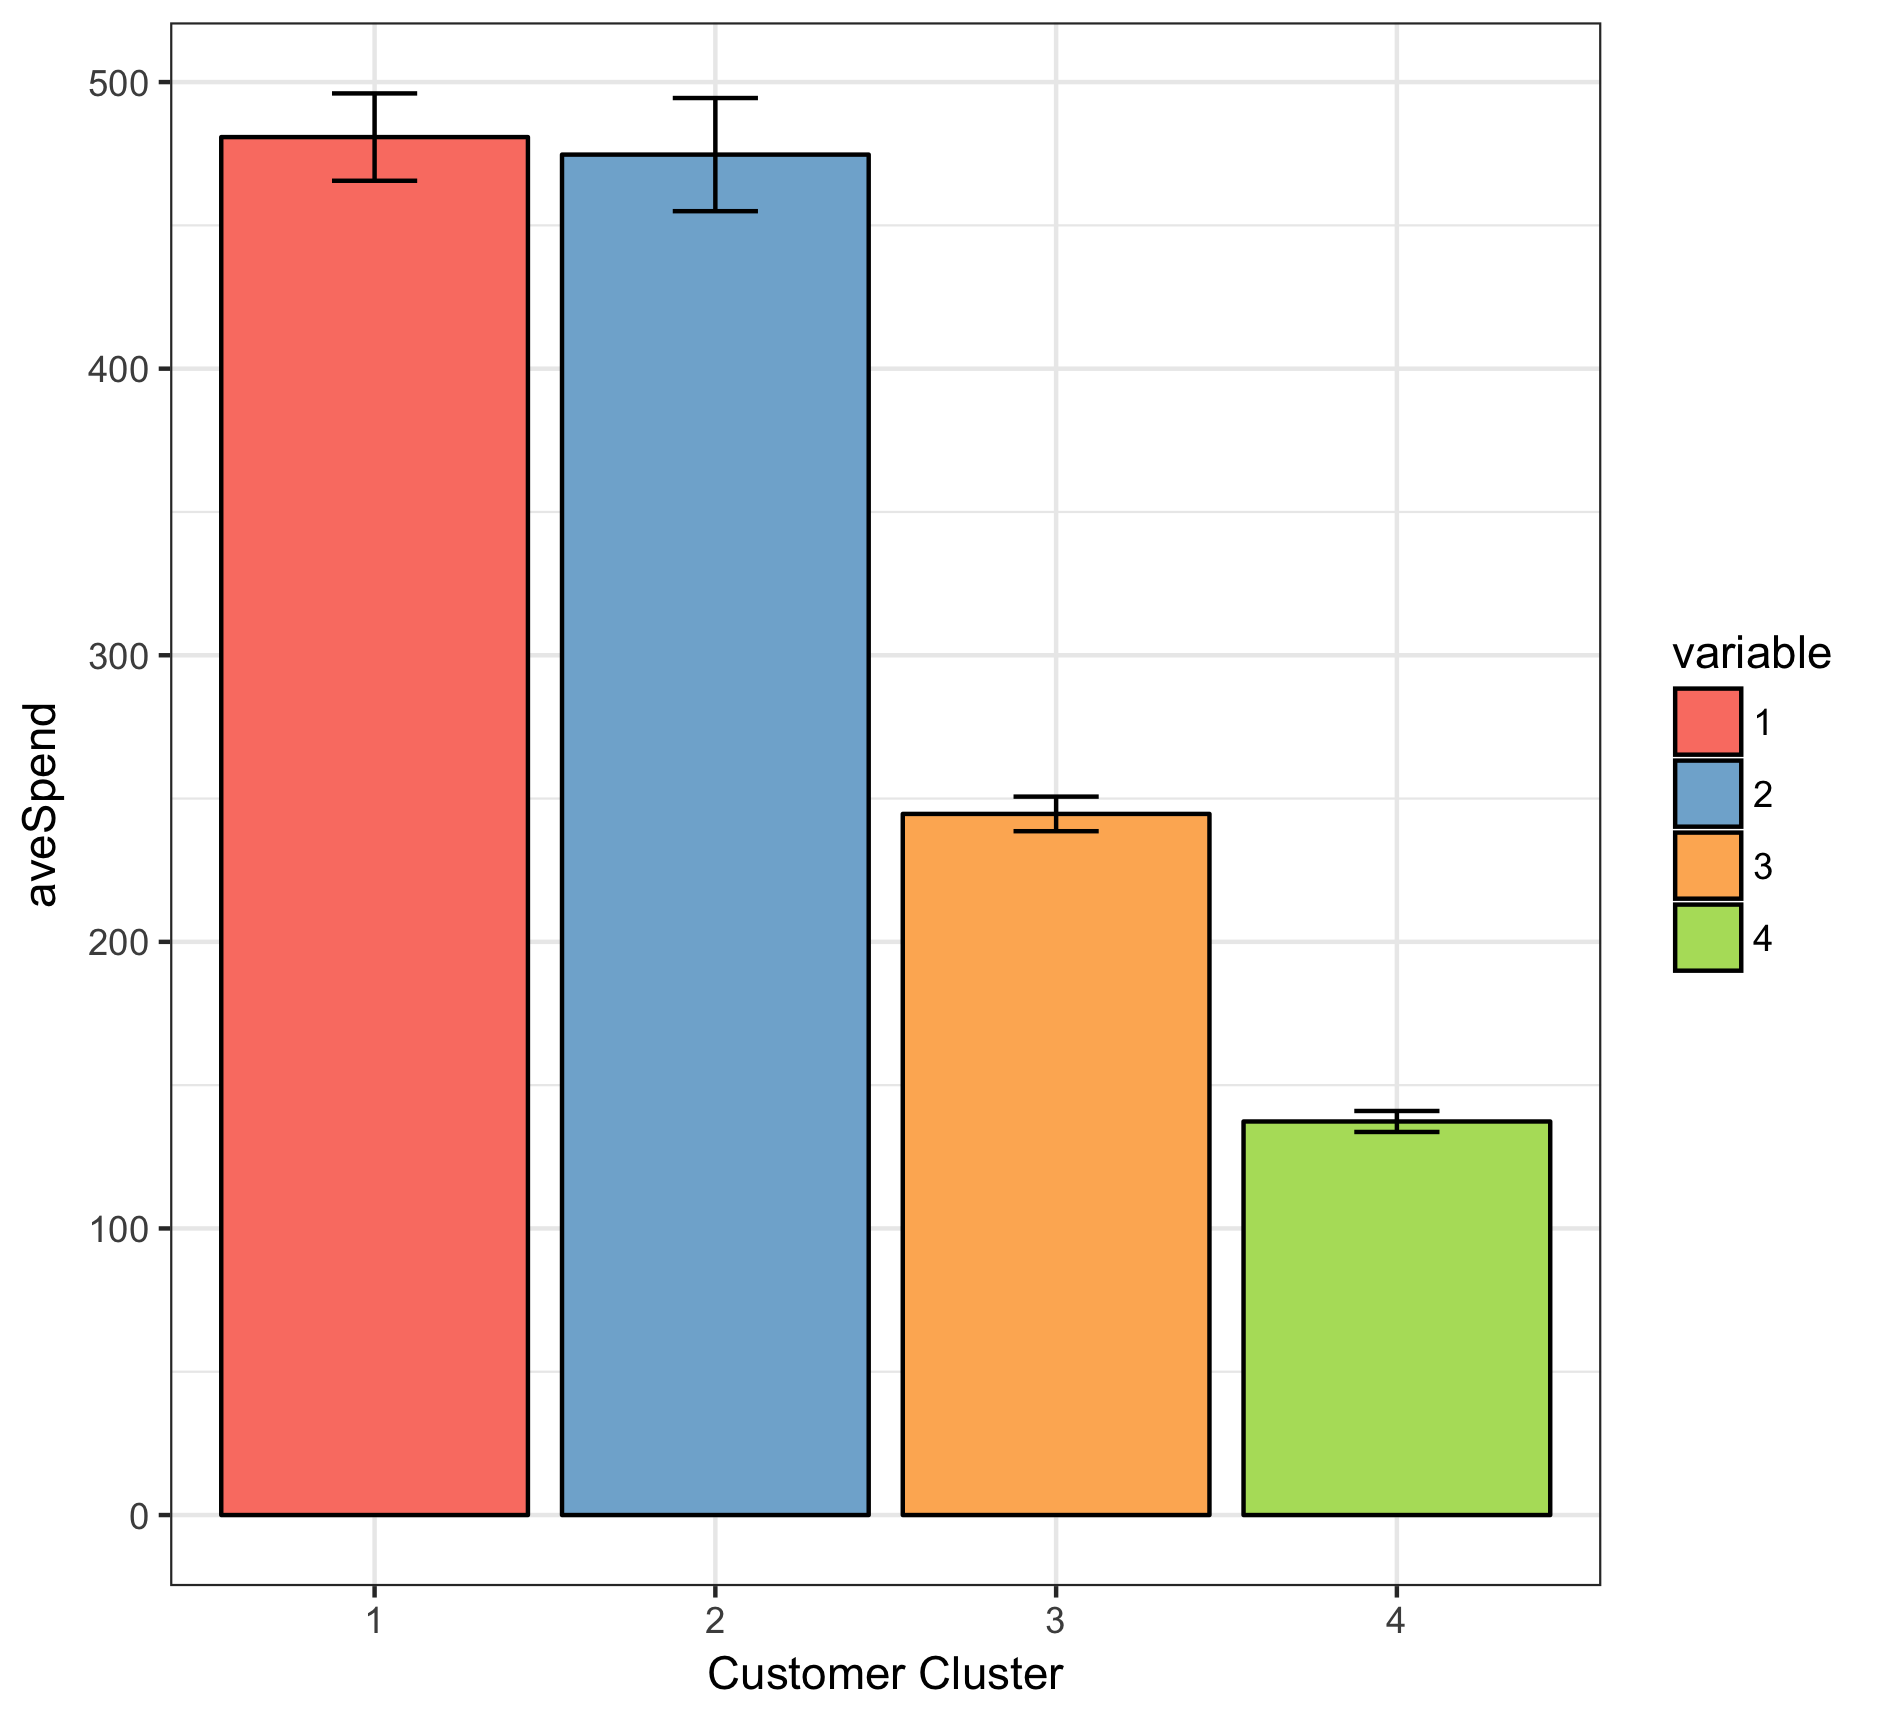
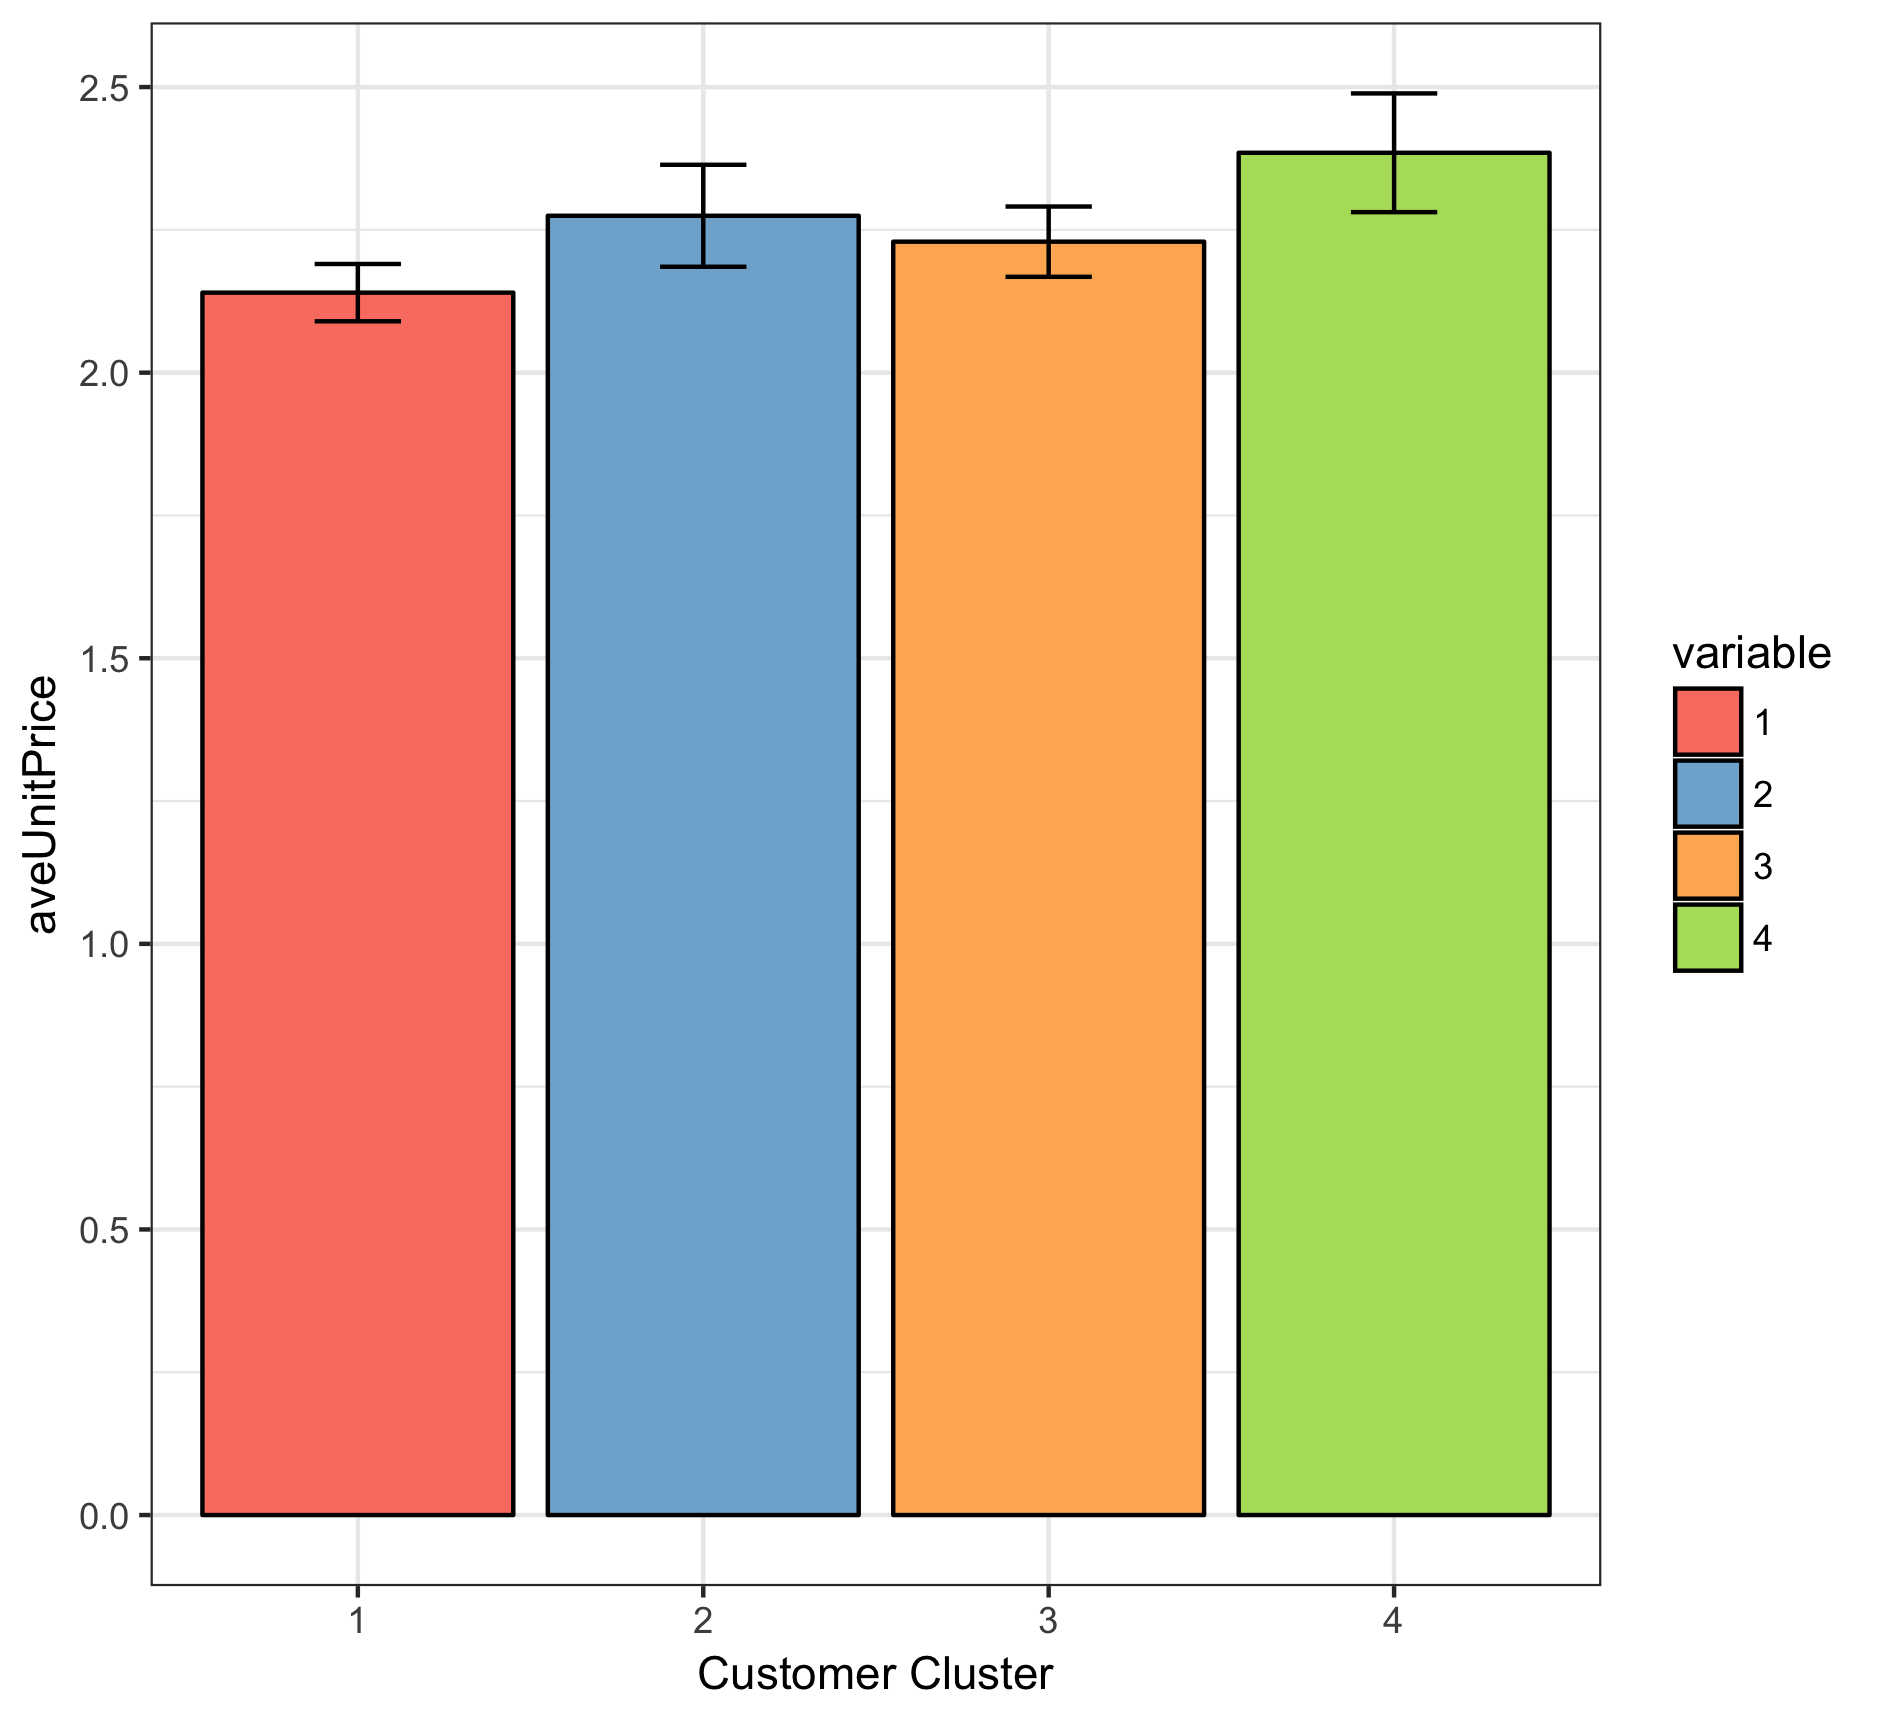
Customer analysis by cluster:
- Customers in cluster 1 have the largest amount of transactions, and also contributed the most revenue for the company.
- Customers in cluster 3 have nearly the same average spending as the customers in cluster 1, indicatig that they tend to purchase high-price product in each transaction.
IV. Customer Repurchase Prediction
Since the transaction is from year 2010 to year 2011, we treat the transactions from 2010/12 to 2011/11 as our training data and 2011/12 as our test data. In our training data, we split 20% of data into validation set and the remaining into training set.
Our model achieved 78% accuracy rate and the performance below is conducted via 5-fold cross validation:
| Fold | 1 | 2 | 3 | 4 | 5 | Average | SD |
|---|---|---|---|---|---|---|---|
| Accuracy | 0.790 | 0.771 | 0.783 | 0.753 | 0.804 | 0.780 | 0.019 |
| AUC | 0.774 | 0.752 | 0.739 | 0.748 | 0.777 | 0.758 | 0.017 |
V. Summary
What we've done:
- Characterized products using text analysis and provided insight on product categories by K-means clustering
- Analyzed customer behaviors and conducted customer segmentations for personalized recommendations and data-driven marketing
- Built a logistic regression model to predict whether customers return in the next month, achieving 78% accuracy and 75% AUC in 5-fold cross-validation
Next steps:
- Build a specific LR models for each cluster. Every time when a customer purchased the products, we could first determine which cluster he/she belongs and then use that cluster's model to predict his/her repurchase rate. Based on the prediction outcome, we could better optimize our marketing budget allocation.
- Further analyze the most popular product in each customer cluster and provide personalized recommendation for each cluster!